![]()
 “Okay, I’ve got that box of receipts, vendor bills, loan docs, paid invoices … so what goes where?”
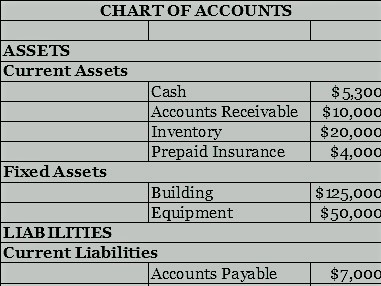
When you review your financial reports, you might be wondering about the different categories listed in them. Each of these categories is called an Account, and together they form a very important list called the Chart of Accounts, which are used to group all the financial transactions in your business (represented by all of those papers you have gathered).
There are seven general groups of accounts:
- Assets
- Liabilities
- Equity
- Revenues
- Expenses
- Gains
- Losses
You’ve seen most of these labels in previous posts: the first three groups make up the Balance Sheet, and the other four groups make up the Income Statement (the Statement of Cash Flows is generated using parts of each of these reports).
You’re probably familiar with and often use several accounts: Cash, Accounts Receivable, Accounts Payable, Sales, Rent, Utilities, Inventory, Salaries & Wages, Office Supplies and so on. However, some may not be relevant to you at all – for example, if you operate on a cash-and-carry basis, you might not use the Accounts Receivable entry routinely.
One useful thing to do is to divide those accounts you do use down into very specific subgroups as needed (utilities are sometimes separated into electricity, natural gas, internet and telephone). There could also be specific groups based on your business’s industry: veterinarians could separate revenue into clinic visits and surgical services, or dog groomers could divide blades and brushes into separate expense subgroups. Having a good level of detail will help you understand your business better by seeing what segments are performing well and which need attention.
Being able to connect revenues and expenses to each other in by relevant category allow you analyze a given business segment’s profitability at a given point in time and as a trend. Decisions about pricing, staffing and inventory levels become better grounded when you can see how specific revenue and cost streams are behaving.
One warning: Avoid the temptation to break things down into too many sub-accounts. The bookkeeping work will become too time-consuming to maintain and can actually make it hard to separate real information from noise. You and your bookkeeper need to think carefully about the relevance of the categories chosen. Industry associations often can help with this as well.
As you can see, the chart of accounts is very important in understanding how your financial activities are grouped together. You manage what you can measure!
